
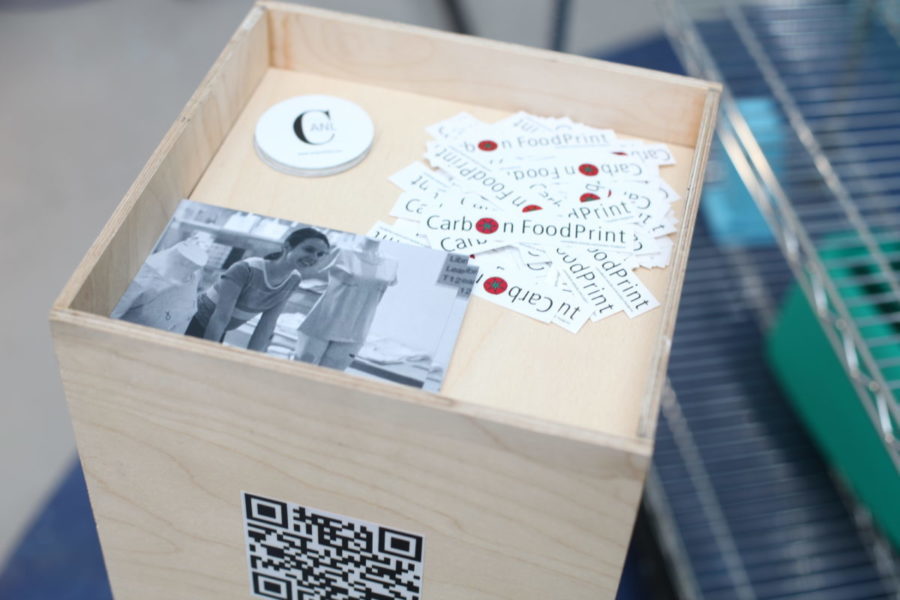
Carbon FoodPrint
CARBON FOODPRINT
Carbon FoodPrint
Event London Design Festival What Interaction Design When September 2019 (5 weeks)
Carbon FoodPrint is an interactive installation that visualises the environmental impact of sandwiches by converting CO2 data into their equivalence in driven miles.
This installation communicates the importance of factoring in location, season, climate and agriculture practices to make a more exact evaluation of the carbon footprint of food. While looking at the carbon impact of sandwiches, this installation focused on the different carbon footprints of tomatoes.
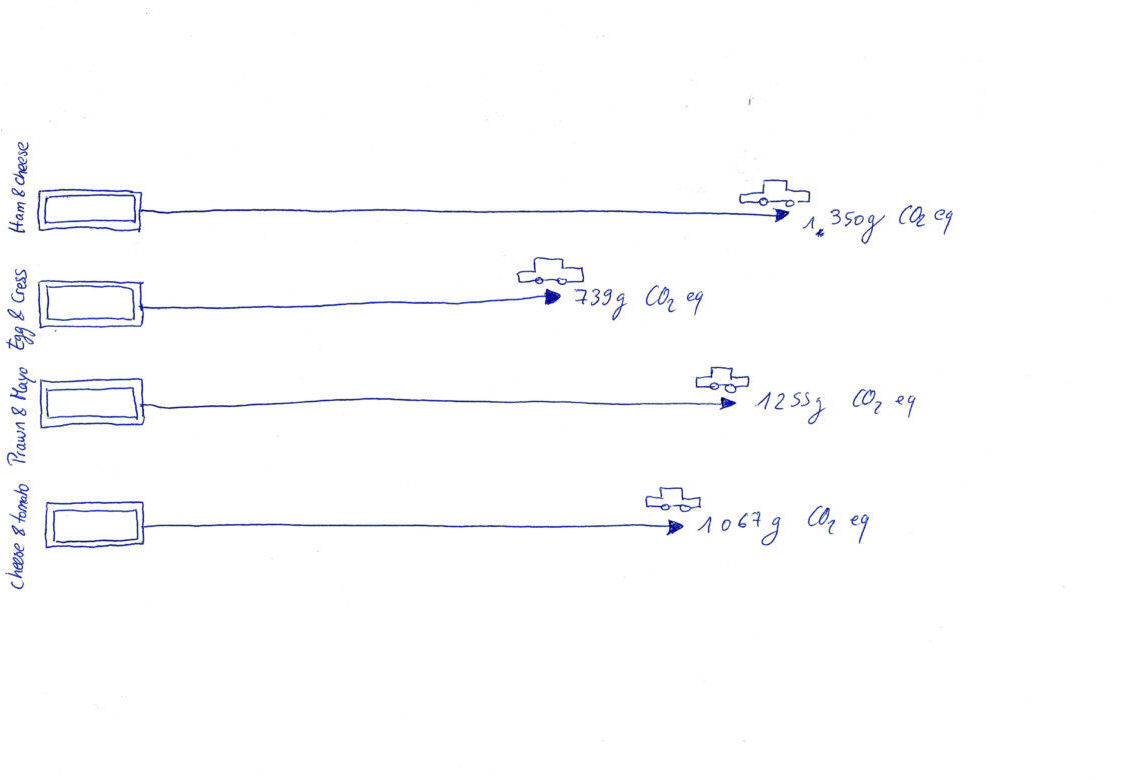
Carbon footprint is a recent indicator. Nowadays, there is abundant information about this measurement and it can easily become overwhelming. Thus, the aim of this project is to simplify this information. To make CO2 numbers more relatable, I have visualised their equivalence in car driven miles. The carbon emission of cars is a measure that everyone understands.
Event London Design Festival What Interaction Design When September 2019 (5 weeks)
Carbon FoodPrint is an interactive installation that visualises the environmental impact of sandwiches by converting CO2 data into their equivalence in driven miles.
This installation communicates the importance of factoring in location, season, climate and agriculture practices to make a more exact evaluation of the carbon footprint of food. While looking at the carbon impact of sandwiches, this installation focused on the different carbon footprints of tomatoes.
Carbon footprint is a recent indicator. Nowadays, there is abundant information about this measurement and it can easily become overwhelming. Thus, the aim of this project is to simplify this information. To make CO2 numbers more relatable, I have visualised their equivalence in car driven miles. The carbon emission of cars is a measure that everyone understands.
London Design Festival
The project was exhibited during the Design Degree Show at the London College of Communication. It was a huge success, which led Carbon FoodPrint to be selected for the London Design Festival (LDF). I also got invited to present it to Method, a design studio in London.
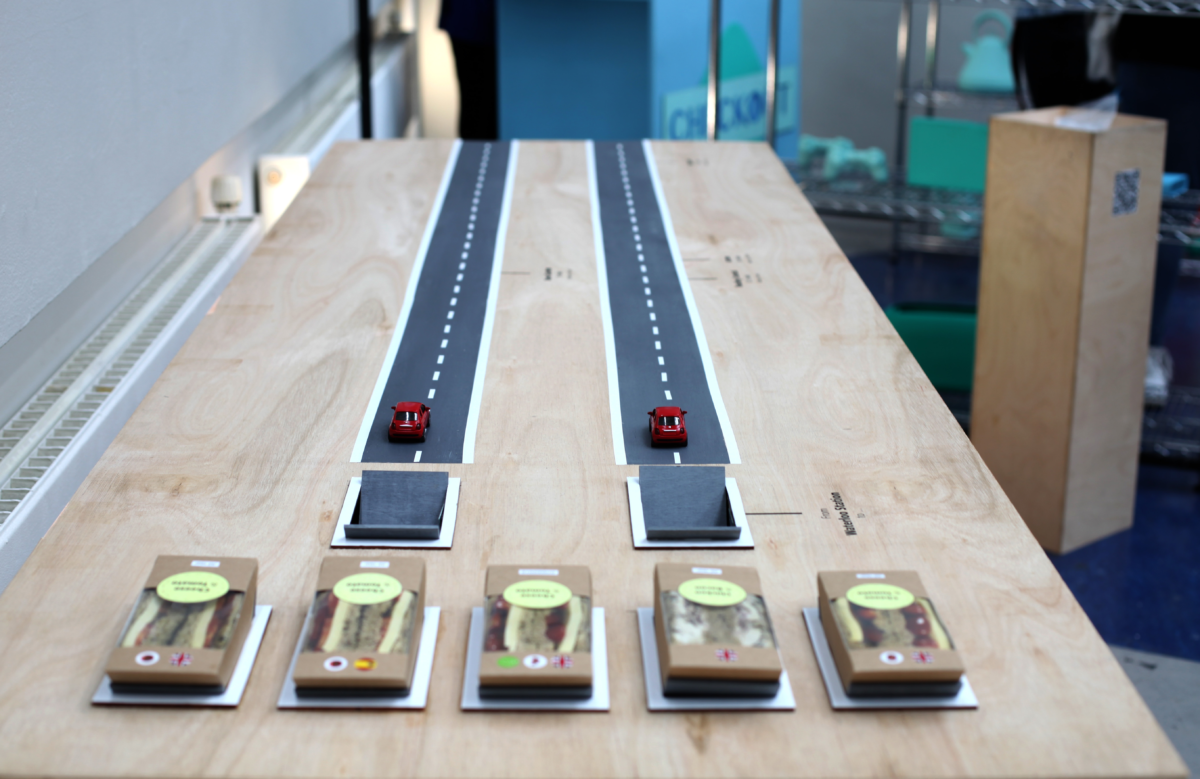
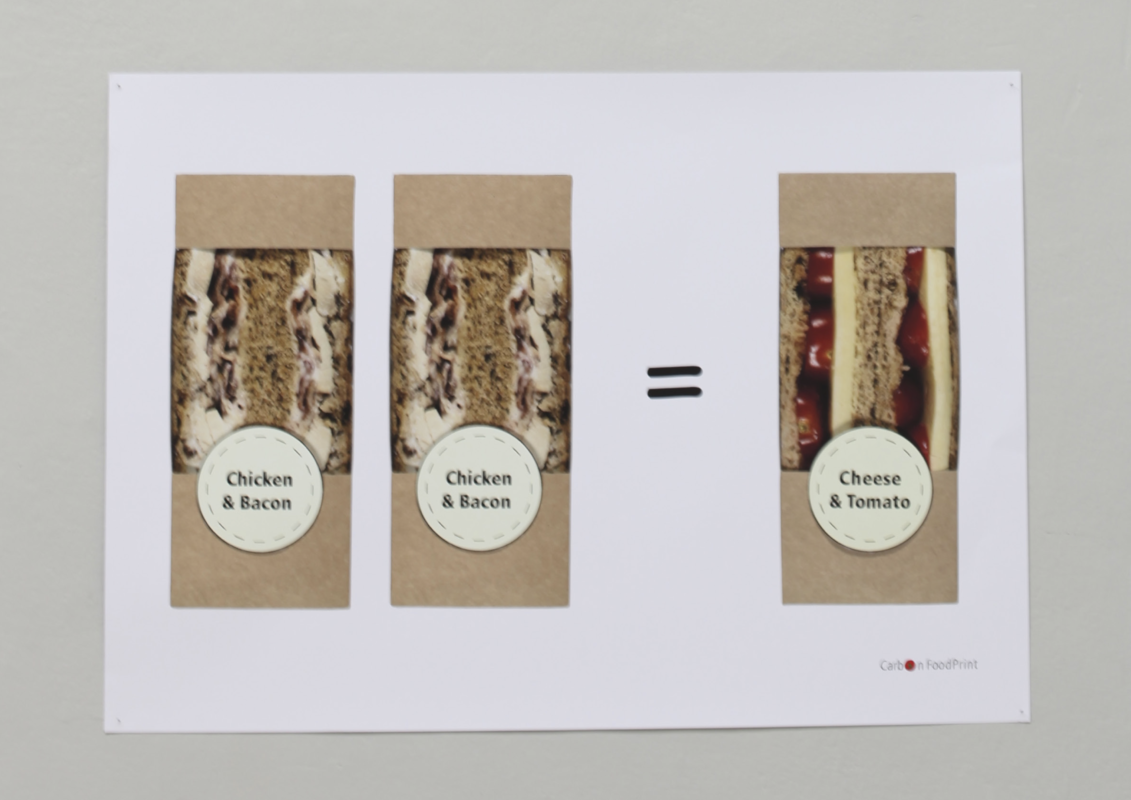
During the event, two participants were invited to select the sandwich they presumed had the lowest carbon footprint in order to compare their impact.
They had the choice between four different tomato and cheese options and one chicken
and bacon sandwich. The tomato and cheese sandwiches were differentiated by the production location, agricultural practices (organic or conventional), and season.
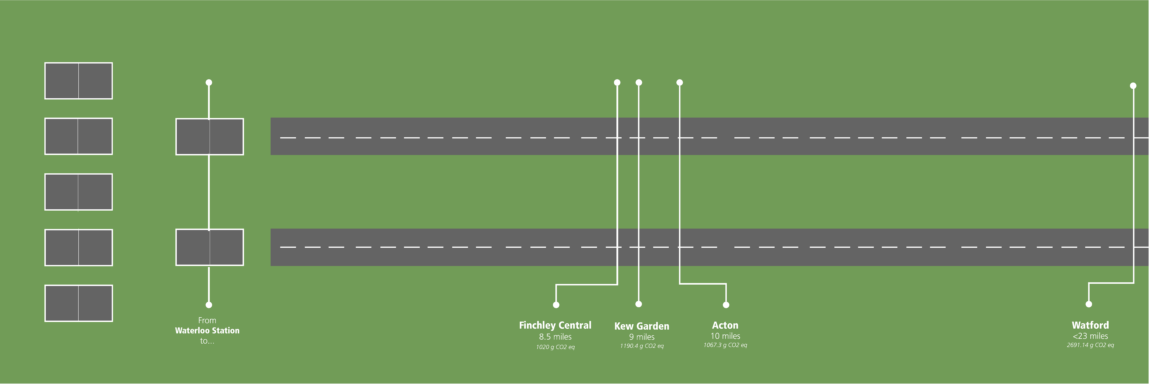
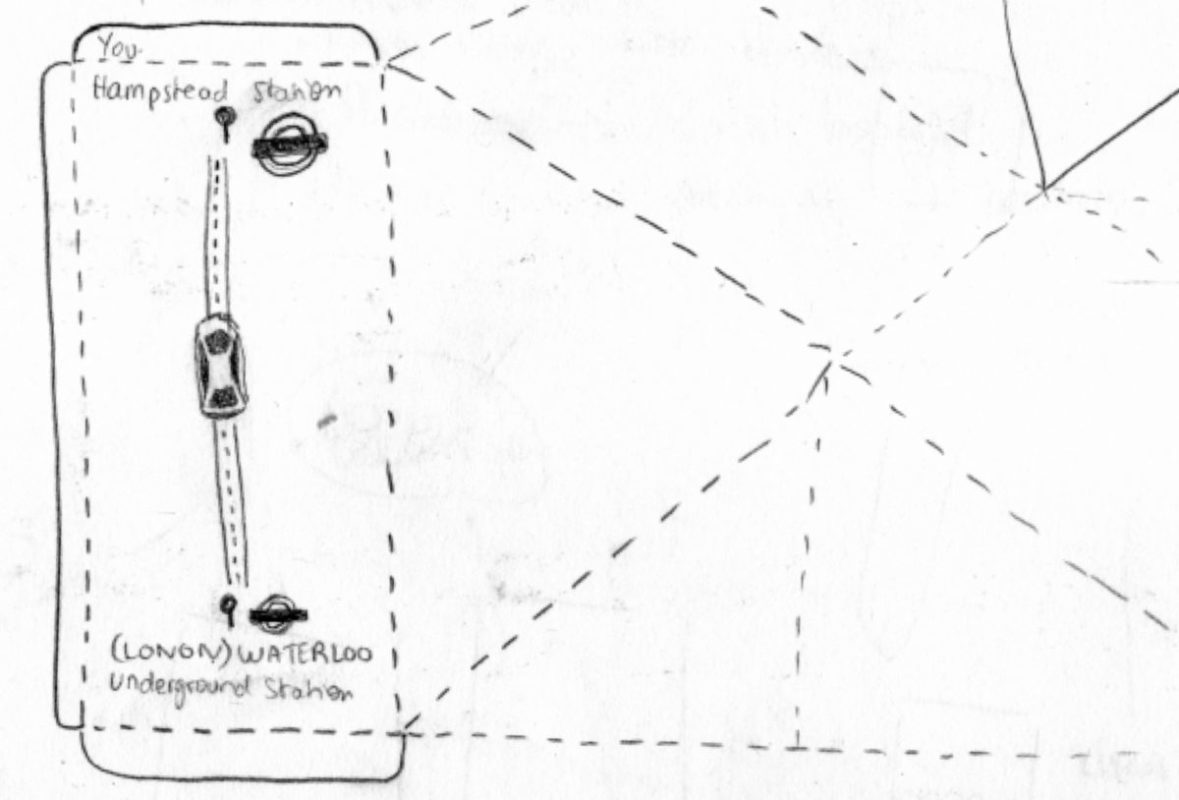
Placing the selected sandwich in its parking spot caused the car to move forward. The car stopped when the distance reflecting the sandwich carbon footprint was reached, hence allowing to visualise the CO2 impact in car driven miles equivalent.
The sandwich ‘race’ starts at London Waterloo and can stop any time between Finchley Central (8.5 miles), Kew garden (9 miles), Acton (10 miles) or even as far as Watford (23 miles), depending on the type of sandwich.
The choice of a red Fiat 500 is mainly a design decision. Red and round, it can be associated with tomatoes. Additionally, the Fiat 500 emits less CO2, which allowed a better comparison between the different sandwiches.
Concept: Translating CO2 data from food into car-driven miles
The food industry has become a complex challenge for our environment. According to the World Economic Forum (2016), the food we eat is responsible for a third of the global carbon footprint emitted.
Unsurprisingly, red meat has the highest carbon footprint of all foods. Lamb and beef, in particular, are the most noxious meats because they generate a lot of methane and require great amounts of water. Some studies even claim that the meat and dairy industries are the biggest threat to climate change.
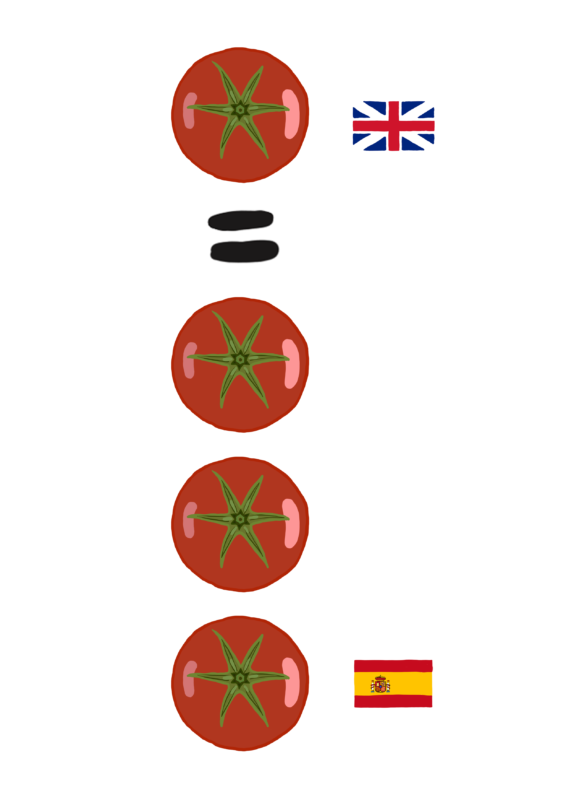
However, some fruits and vegetables can also have a major impact on the environment. In fact, depending on the time of the year, the location, the climate, and the agricultural practices, the same product can have different effects on the environment.
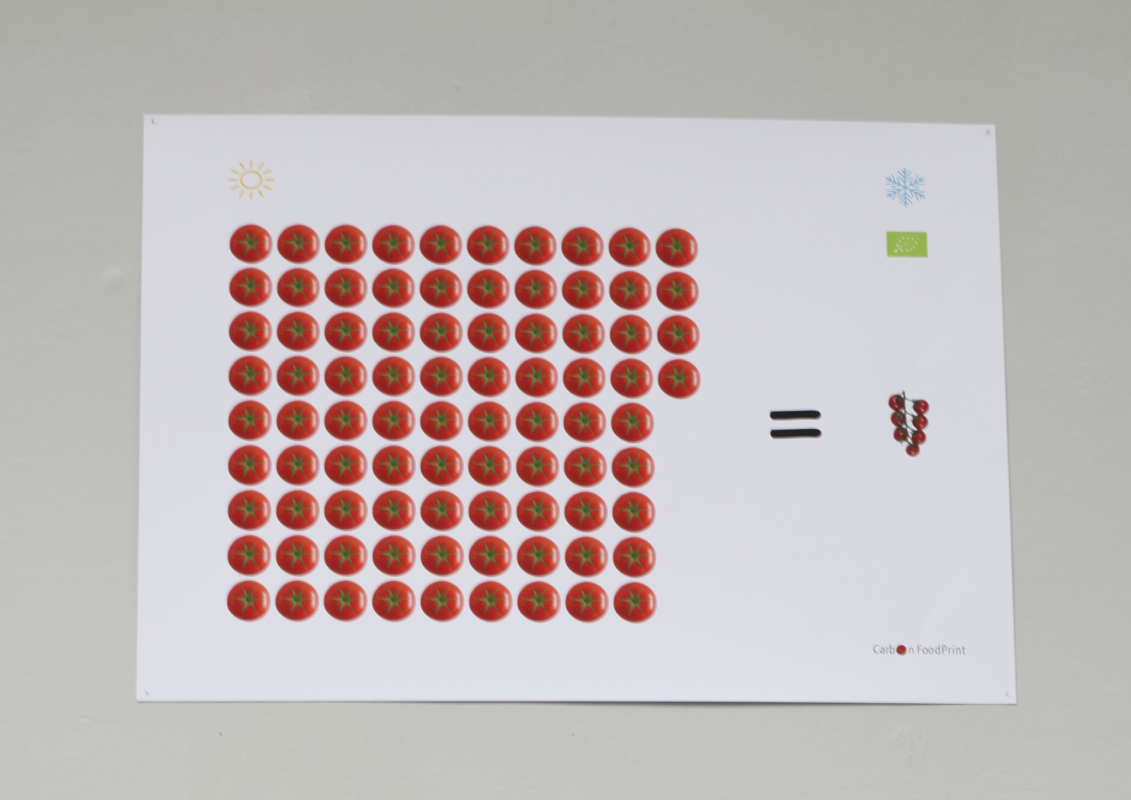
Tomatoes, in particular, are quite tricky to label. Grown during cold seasons, tomatoes can generate up to 50 times more damage than during summer.
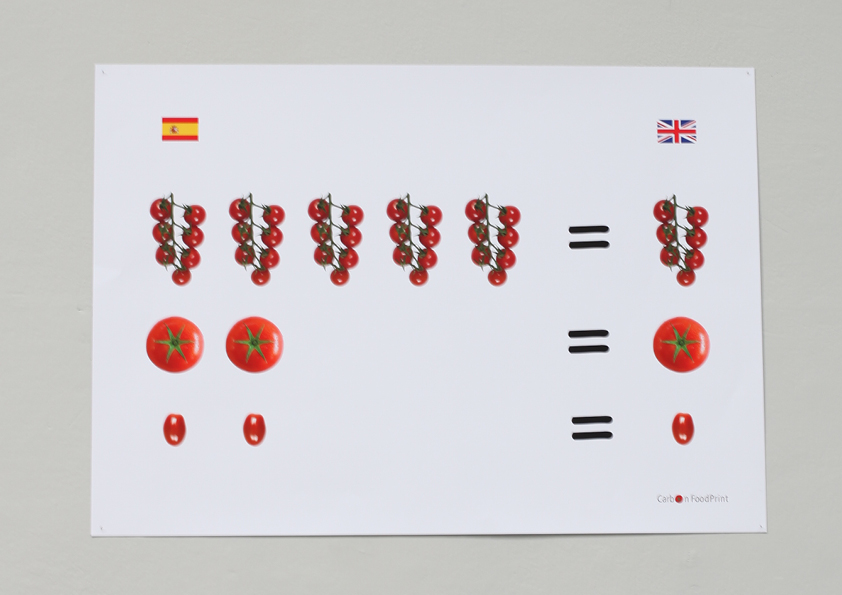
Environmentally, it is better to consume local tomatoes grown in season. In the UK, their season generally starts in July and ends in October.
However, it is generally less energy-intensive to grow tomatoes from Spain because the climate is warmer and no heating is required. Food miles are far less harmful than consuming vegetables or fruits out of season.
The main contributor to the tomato’s carbon cost is lighting and artificial heating. According to Durham University: ‘Tomatoes grown in the UK are grown in large greenhouses requiring huge amounts of energy for both heating and lighting, which is usually produced by burning oil and gas or by importing electricity from the national grid’.
Research
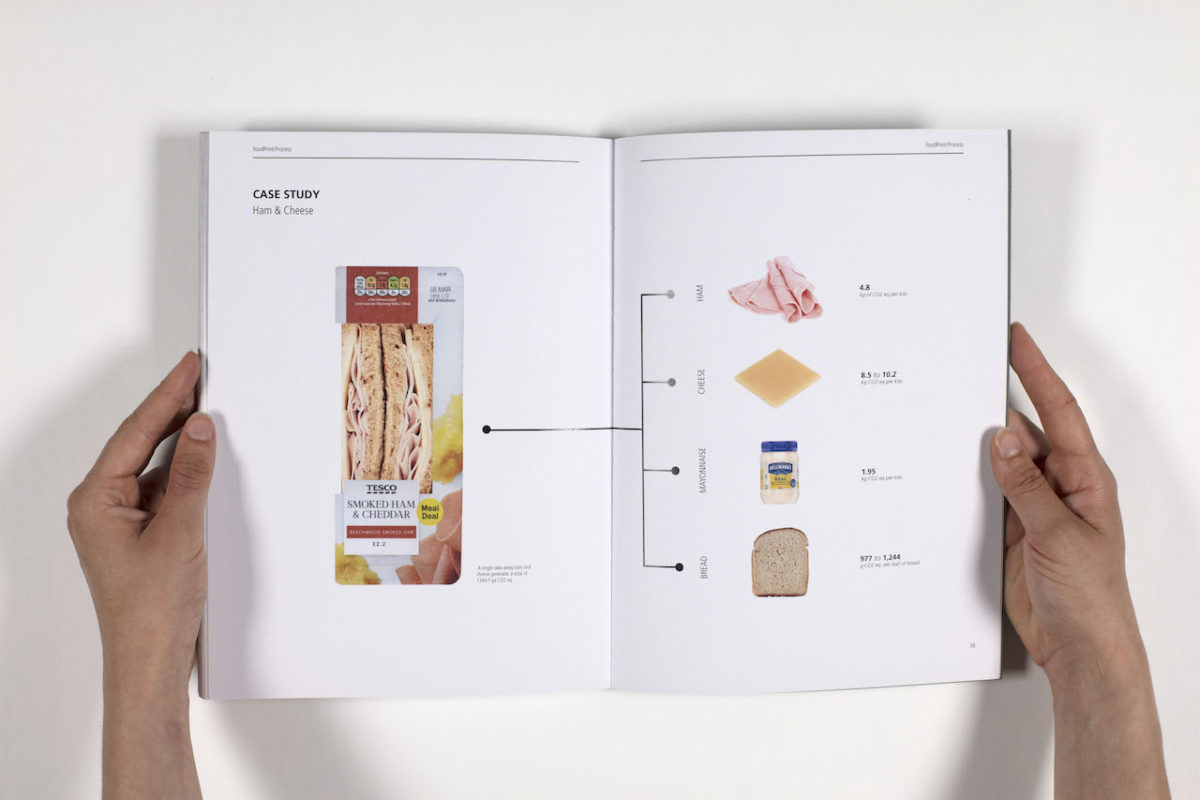
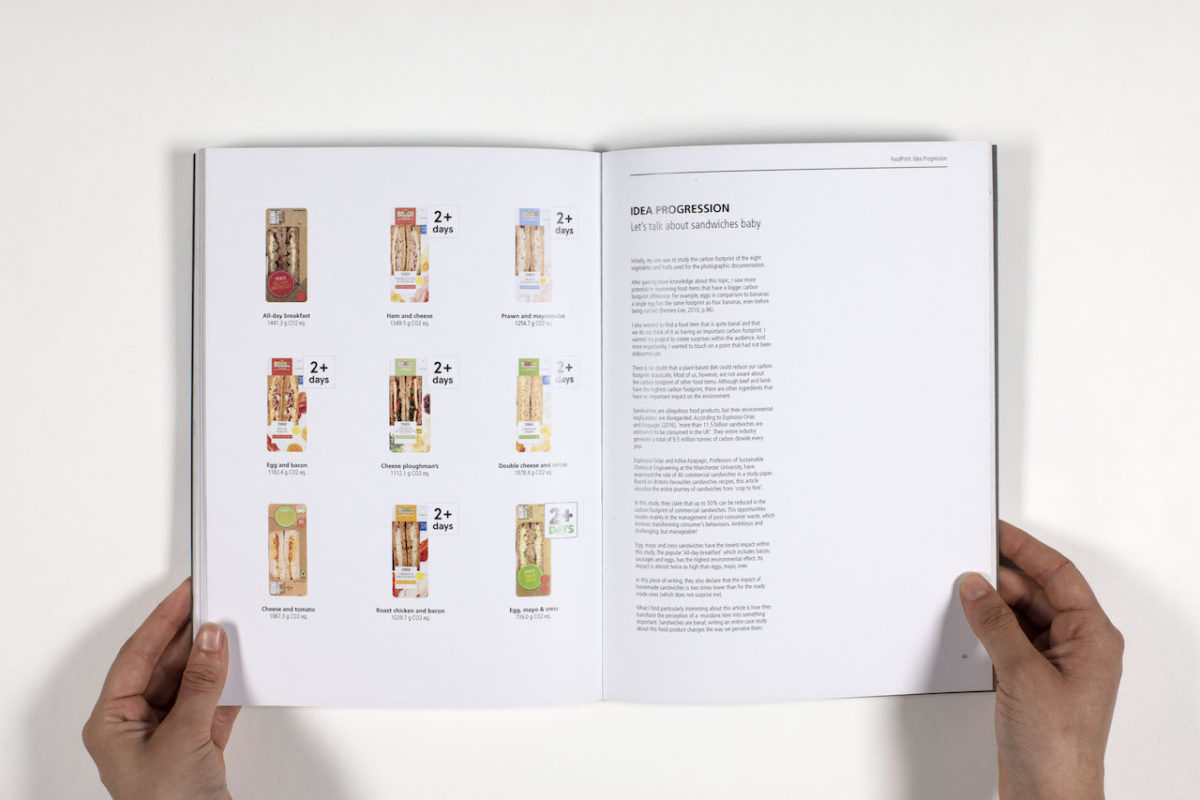
At first sight, sandwiches all look pretty similar; yet comparing their impact can reveal surprising conclusions.
Sandwiches are ubiquitous food products, but their environmental implications are disregarded. They are a reflection of our ‘on-the-go’ culture.
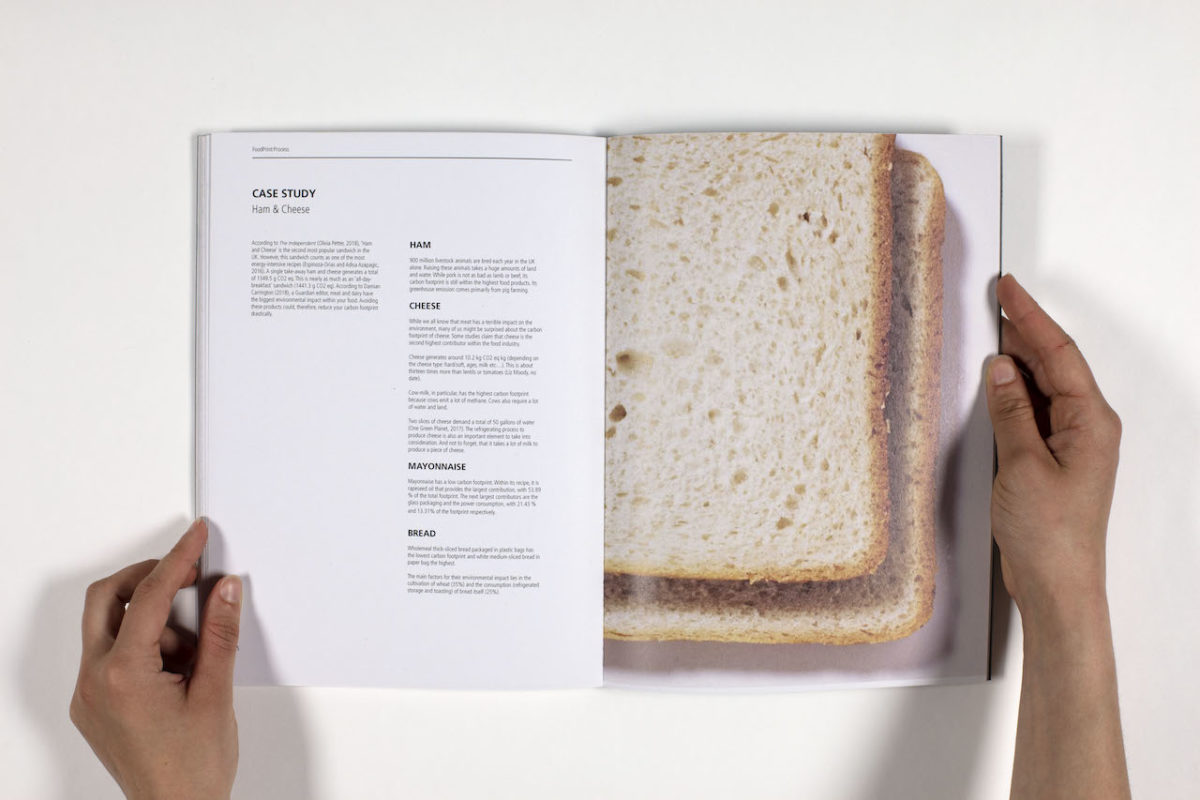
My research is based on a range of different sources. However, what triggered this project is a study called Understanding the impact on climate change of convenience food: Carbon footprint of sandwiches. It was written by two Professors of Sustainable Chemical Engineering at Manchester University. Espinoza-Orias and Adisa Azapagic have studied the carbon impact of 40 commercial sandwiches, focusing on Britons' favourites sandwiches recipes.
In this article, the two professors describe the entire lifecycle of these sandwiches, including every step from ‘crop to fork’. According to Espinoza-Orias and Azapagic (2016), ‘more than 11.5 billion sandwiches are estimated to be consumed in the UK’. Their industry generates a total of 9.5 million tonnes of carbon dioxide every year.
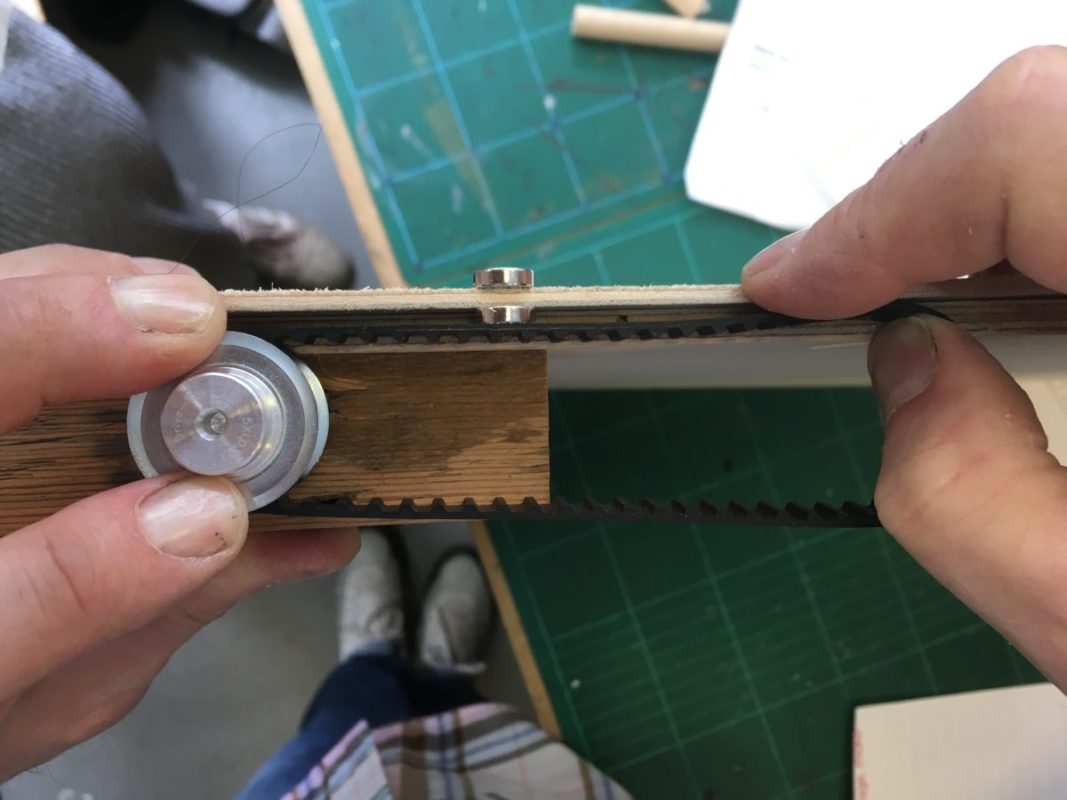
Transferring ideas to sketches
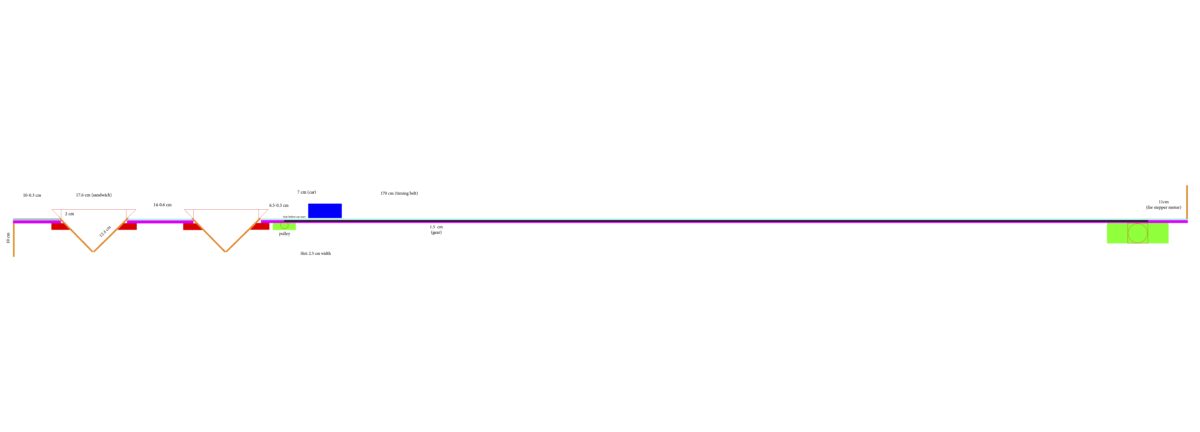
The choice of the material was key to making the mechanism function. One complication, for example, was to position the timing belt as close as possible to the upper wood platform.
In terms of the system, I attached two RFID readers in each of the parking spots, which were connected to Arduino boards (translating the code into a distance).
Each sandwich was labelled with a MIFARE sticker, which enables the stepper motors to rotate once in contact with the RFID reader.
I glued three magnets under each car as well as on the timing belt, which enabled the cars to move back and forth every time the timing belt was in movement.
I also included a 20 seconds delay allowing the car to return to its starting position after reaching its destination.
Testing the system
Translating information
Next to the installation, I added three posters that aimed at catching people’s attention and also at providing the public with more detailed information.
Translating information
Next to the installation, I added three posters that aimed at catching people’s attention and also at providing the public with more detailed information.
For those who wanted to learn more about the project, I developed a pdf-website that includes information about the different environmental impacts of tomatoes.
At the end of the page, there is also a paragraph providing people with ideas on how to improve their food habits.
The website was printed on stickers. For more information visit Carbon FoodPrint.
Labelling carbon footprint on food
How to make this information accessible to more people?
After all this research and having put the missing pieces together, I wanted to make this data accessible to more people. By including information on the food products we buy, I wanted to change our shopping experience.
Imagine, what would happen if we added the environmental impact of each food item on its packaging? How would that impact our shopping habits?
Unlike money, we are not used to thinking about carbon costs. When we buy a product we take into account the price, the nutritional information, calories, ingredients, check our allergies if we have any, and the packaging. However, the CO2 impact has no influence on our shopping decisions.
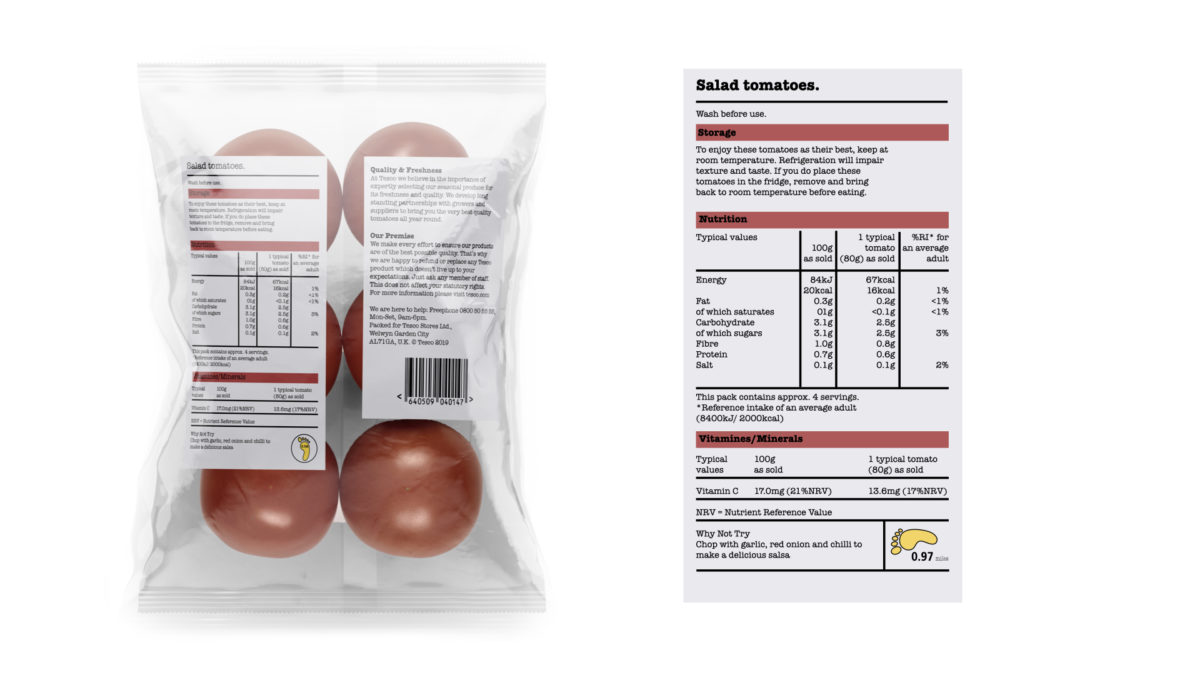
I decided to re-design a tomato packaging based on the project Carbon FoodPrint and imagine how this could become a norm in the future.
*The design is based on Tesco´s packaging, as a part of my research was based on the carbon footprint of their items. Tesco is the biggest supermarket chain in the UK. By integrating it into its brand identity, I am hoping to encourage more brands to include it in their products.
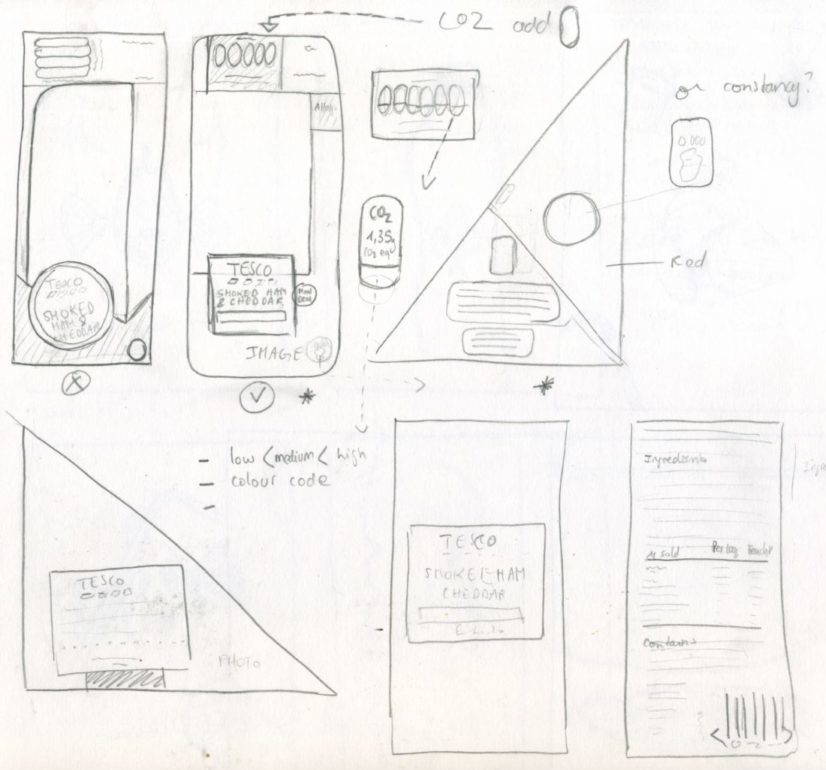
I tried to conceptualise other ways to make this invisible data (carbon footprint) visible on food packaging. Instead of using numbers that no one can relate to or using the colour code system of the traffic light, which has a little emotional impact on the buyer, I looked at how to make it more tangible. By transferring the Carbon FoodPrint project onto sandwich packaging and having the translated information into car-driven miles, I wanted to design something people will remember.